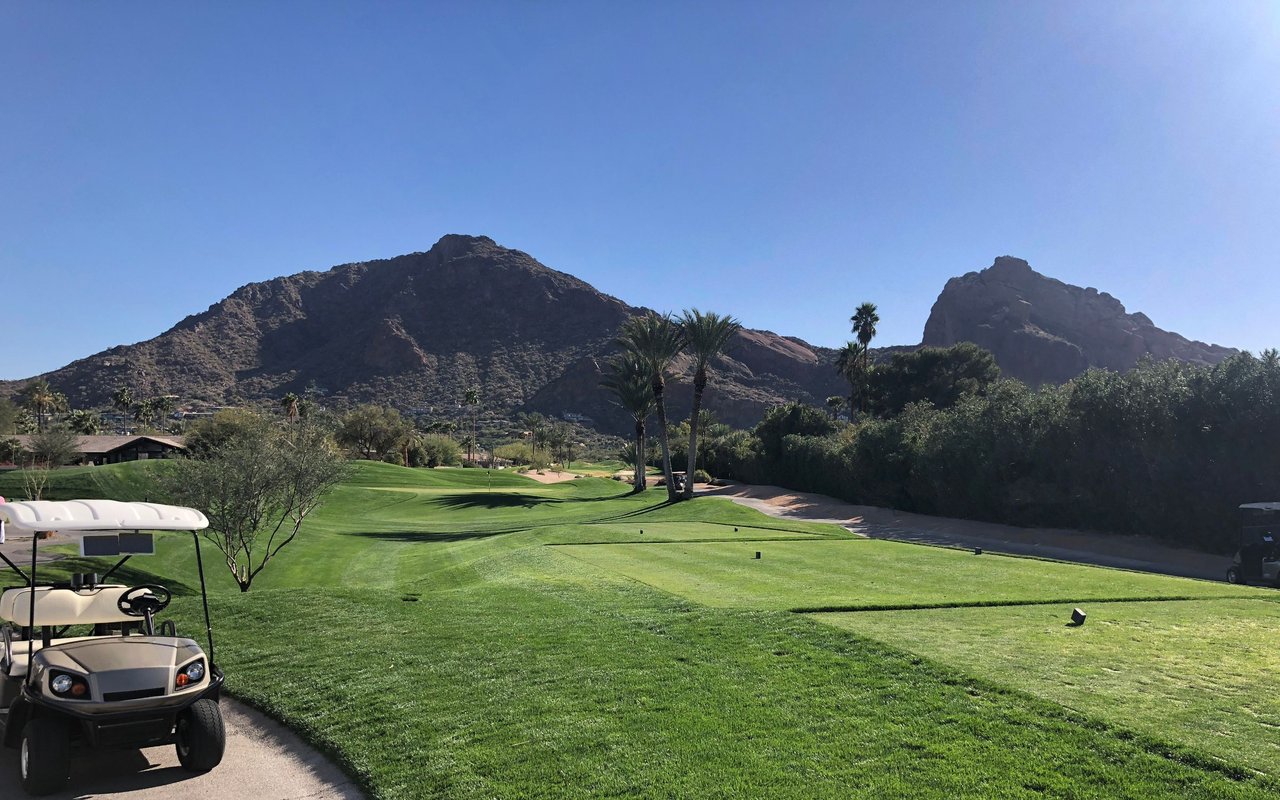
There's something appealing about San Tan Valley's wide-open spaces, beautiful desert scenery, and the feeling of being just a little farther removed from the pace of the city. Located in northern Pinal County, southeast of the Phoenix metropolitan area, San Tan Valley has grown from a largely rural landscape into a collection of established neighborhoods, newer master-planned communities, and properties with room to spread out. I love the views of the San Tan Mountains, the spectacular Arizona sunsets, and the area's connection to the natural desert landscape. Nearby San Tan Mountain Regional Park offers wonderful opportunities for hiking, biking, and exploring the outdoors. While shopping, dining, and everyday conveniences continue to expand, San Tan Valley is truly tucked away from the heart of the Valley. That location is part of its appeal, but it's also worth considering travel times, particularly for anyone commuting regularly to central Phoenix. What I appreciate most about San Tan Valley is the opportunity to enjoy a little more breathing room, beautiful surroundings, and a community that continues to develop its own identity.
105,231 people live in San Tan Valley, where the median age is 35 and the average individual income is $35,614. Data provided by the U.S. Census Bureau.
Total Population
Median Age
Population Density Population Density This is the number of people per square mile in a neighborhood.
Average individual Income
There's plenty to do around San Tan Valley, including shopping, dining, nightlife, parks, and more. Data provided by Walk Score and Yelp.
Explore popular things to do in the area, including WinCo Foods, Subway, and Arby's.
| Name | Category | Distance | Reviews |
Ratings by
Yelp
|
|---|---|---|---|---|
| Dining · $$ | 1.05 miles | 12 reviews | 3.3/5 stars | |
| Dining · $ | 1.08 miles | 21 reviews | 2.1/5 stars | |
| Dining | 1.08 miles | 20 reviews | 2.5/5 stars | |
| Dining | 1.08 miles | 54 reviews | 3.8/5 stars | |
| Dining · $ | 1.1 miles | 134 reviews | 1.9/5 stars | |
| Dining · $$ | 1.12 miles | 460 reviews | 3.4/5 stars | |
| Dining | 1.14 miles | 0 reviews | 0/5 stars | |
| Dining | 1.14 miles | 5 reviews | 4.2/5 stars | |
| Dining · $ | 1.14 miles | 14 reviews | 1.6/5 stars | |
| Dining · $ | 1.18 miles | 77 reviews | 2/5 stars | |
| Dining · $ | 1.19 miles | 157 reviews | 2.7/5 stars | |
| Dining · $$ | 1.2 miles | 397 reviews | 2.4/5 stars | |
| Dining · $ | 1.2 miles | 82 reviews | 2/5 stars | |
| Dining · $ | 1.2 miles | 53 reviews | 1.9/5 stars | |
| Shopping | 0.99 miles | 0 reviews | 0/5 stars | |
| Active | 0.81 miles | 1 review | 5/5 stars | |
| Active | 0.94 miles | 3 reviews | 3/5 stars | |
| Active | 1.18 miles | 8 reviews | 1.4/5 stars | |
| Beauty | 0.79 miles | 1 review | 5/5 stars | |
| Beauty | 0.79 miles | 0 reviews | 0/5 stars | |
| Beauty | 0.79 miles | 1 review | 5/5 stars | |
| Beauty | 1.01 miles | 0 reviews | 0/5 stars | |
| Beauty | 1.08 miles | 177 reviews | 3.6/5 stars | |
| Beauty | 1.11 miles | 41 reviews | 4.2/5 stars | |
|
|
||||
|
|
||||
|
|
||||
|
|
||||
|
|
||||
|
|
San Tan Valley has 33,646 households, with an average household size of 3.13. Data provided by the U.S. Census Bureau. Here’s what the people living in San Tan Valley do for work — and how long it takes them to get there. Data provided by the U.S. Census Bureau. 105,231 people call San Tan Valley home. The population density is 1,388 and the largest age group is Data provided by the U.S. Census Bureau.
Total Population
Population Density Population Density This is the number of people per square mile in a neighborhood.
Median Age
Men vs Women
Population by Age Group
0-9 Years
10-17 Years
18-24 Years
25-64 Years
65-74 Years
75+ Years
Education Level
Total Households
Average Household Size
Average individual Income
Households with Children
With Children:
Without Children:
Marital Status
Blue vs White Collar Workers
Blue Collar:
White Collar: