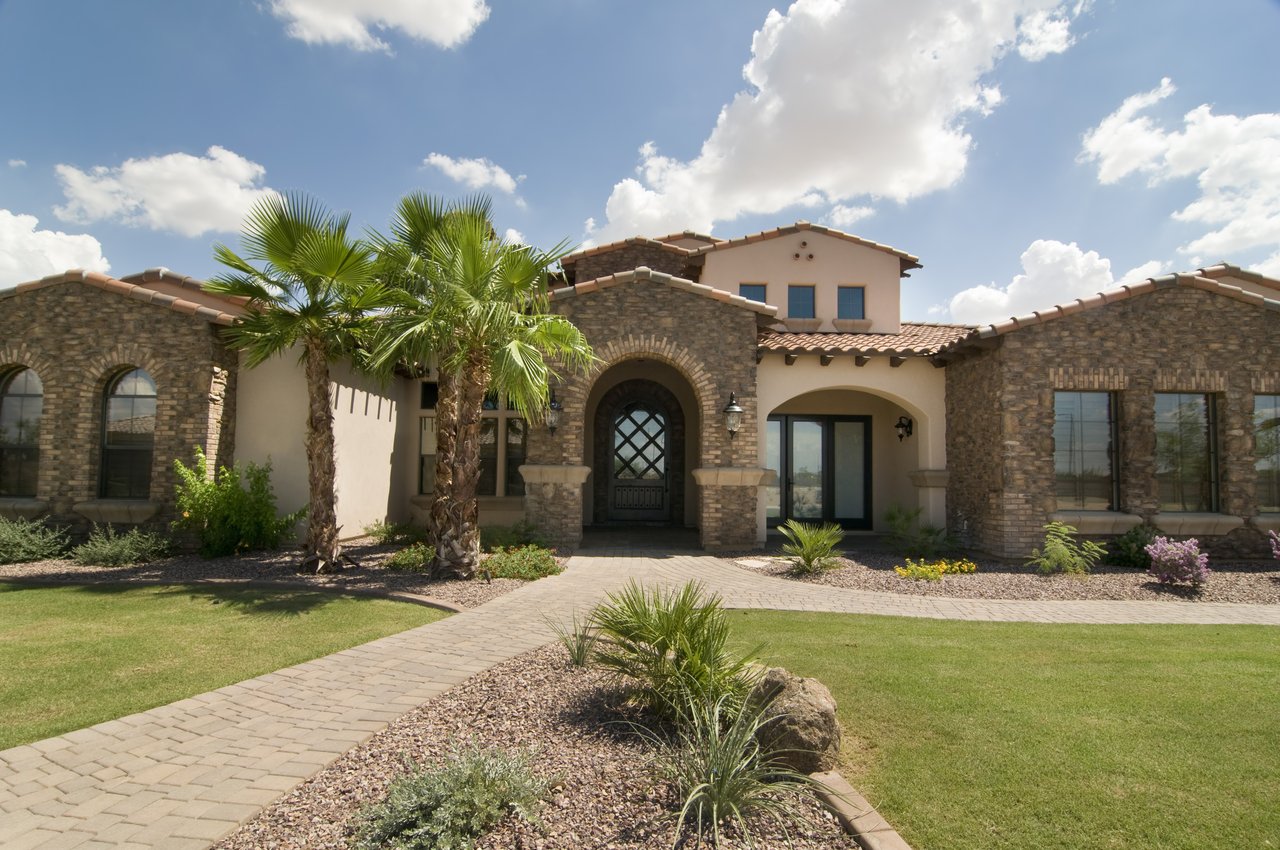
One of the things I love about Queen Creek is how beautifully it blends its agricultural heritage with the excitement of a growing community. There's still a wonderful connection to the land here, from the working farms and equestrian properties to the wide-open spaces and views of the San Tan Mountains. Queen Creek has grown tremendously over the years, bringing an impressive selection of shopping, dining, entertainment, and beautiful new neighborhoods, yet it hasn't lost the character that makes it special. Schnepf Farms and the Queen Creek Olive Mill are two of my favorite local treasures, offering everything from seasonal festivals and farm-fresh experiences to delicious food and a taste of the area's agricultural roots. San Tan Mountain Regional Park provides miles of scenic hiking and biking trails, while the community's parks and recreational amenities offer plenty of ways to enjoy the outdoors. From custom homes on spacious lots to thoughtfully designed master-planned communities, Queen Creek offers an appealing variety of lifestyles. What I appreciate most is that even with all its growth, you can still catch glimpses of the rural Arizona that made this area so special in the first place.
93,700 people live in Queen Creek, where the median age is 35.5 and the average individual income is $46,676. Data provided by the U.S. Census Bureau.
Total Population
Median Age
Population Density Population Density This is the number of people per square mile in a neighborhood.
Average individual Income
There's plenty to do around Queen Creek, including shopping, dining, nightlife, parks, and more. Data provided by Walk Score and Yelp.
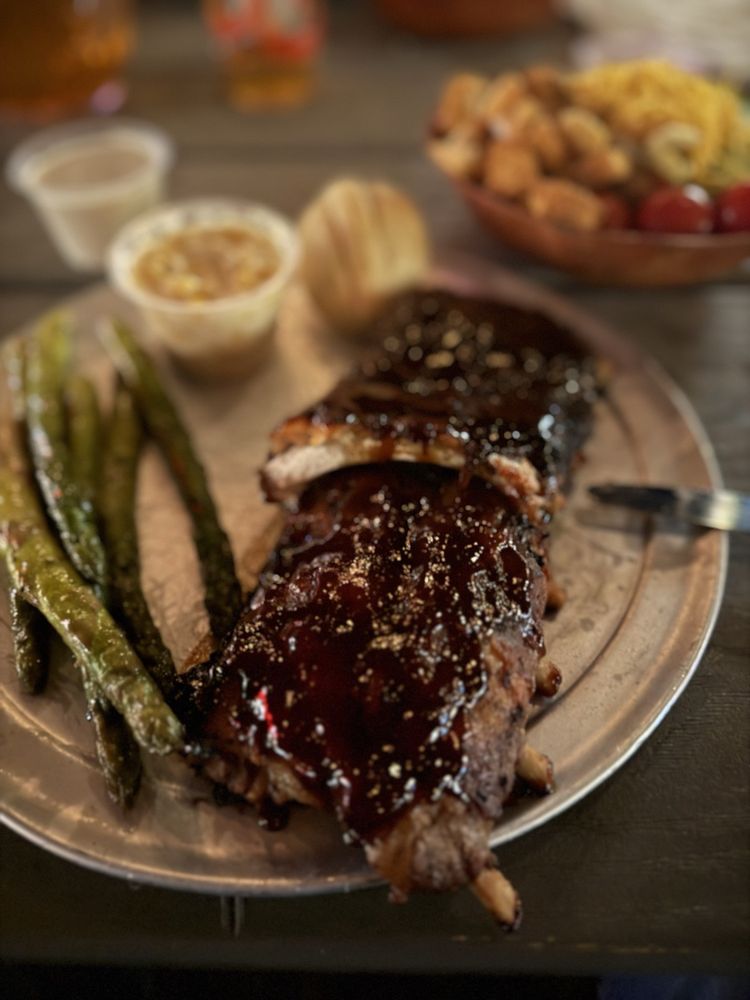
Explore popular things to do in the area, including San Tan Flat, SNACKINATOR, and Heidi Cakes.
| Name | Category | Distance | Reviews |
Ratings by
Yelp
|
|---|---|---|---|---|
| Dining · $$ | 0.31 miles | 1359 reviews | 3.9/5 stars | |
| Dining | 0.37 miles | 0 reviews | 0/5 stars | |
| Dining | 0.37 miles | 0 reviews | 0/5 stars | |
| Dining · $ | 0.37 miles | 9 reviews | 2.8/5 stars | |
| Dining · $ | 0.37 miles | 8 reviews | 4/5 stars | |
| Dining | 0.37 miles | 0 reviews | 0/5 stars | |
| Dining | 0.37 miles | 1 review | 5/5 stars | |
| Dining | 0.42 miles | 10 reviews | 2.6/5 stars | |
| Dining | 1.44 miles | 0 reviews | 0/5 stars | |
| Dining | 1.49 miles | 11 reviews | 1.7/5 stars | |
| Shopping | 0.37 miles | 0 reviews | 0/5 stars | |
| Active | 0.37 miles | 0 reviews | 0/5 stars | |
| Active | 0.37 miles | 0 reviews | 0/5 stars | |
| Active | 0.37 miles | 0 reviews | 0/5 stars | |
| Active | 0.37 miles | 1 review | 5/5 stars | |
| Active | 0.37 miles | 69 reviews | 4.4/5 stars | |
| Active | 0.37 miles | 12 reviews | 3.7/5 stars | |
| Active | 0.37 miles | 9 reviews | 5/5 stars | |
| Beauty | 0.37 miles | 1 review | 5/5 stars | |
| Beauty | 0.37 miles | 0 reviews | 0/5 stars | |
| Beauty | 0.37 miles | 2 reviews | 3/5 stars | |
| Beauty | 0.37 miles | 0 reviews | 0/5 stars | |
| Beauty | 1.47 miles | 17 reviews | 4.5/5 stars | |
|
|
||||
|
|
||||
|
|
||||
|
|
||||
|
|
||||
|
|
Queen Creek has 28,504 households, with an average household size of 3.28. Data provided by the U.S. Census Bureau. Here’s what the people living in Queen Creek do for work — and how long it takes them to get there. Data provided by the U.S. Census Bureau. 93,700 people call Queen Creek home. The population density is 925 and the largest age group is Data provided by the U.S. Census Bureau.
Total Population
Population Density Population Density This is the number of people per square mile in a neighborhood.
Median Age
Men vs Women
Population by Age Group
0-9 Years
10-17 Years
18-24 Years
25-64 Years
65-74 Years
75+ Years
Education Level
Total Households
Average Household Size
Average individual Income
Households with Children
With Children:
Without Children:
Marital Status
Blue vs White Collar Workers
Blue Collar:
White Collar: